- Home
- Figures
- Foreword
- Executive Board
- Share
-
Management report
- Foundations of the Group
- Report on economic position
-
Combined non-financial information statement
- Introduction
- Description of the business model
- Group and sustainability strategy
- Responsible corporate governance
- Compliance
- Risk management
- Stakeholder dialogue
- Risk expertise and risk assessment
- Sustainable insurance solutions
- ESG criteria in asset management
- Customer orientation and satisfaction
- Executive development / Employee advancement
- Employee retention
- Diversity
- Operational environmental protection
- Supplier management
-
Opportunity and risk report
-
Risk report
- Strategy implementation
- Major external factors
- Risk capital
- Risk management
- Risk management system
- Internal control system
- Risk landscape of Hannover Re
- Internal risk assessment
- Underwriting risks in property and casualty reinsurance
- Underwriting risks in life and health reinsurance
- Market risks
- Counterparty default risks
- Operational risks
- Other risks
- Opportunity report
-
Risk report
- Enterprise management
- Outlook
- Accounts
- Supervisory Board
- Sites
Analysis of the consolidated cash flow statement
Liquidity
We generate liquidity from our operational reinsurance business, investing activities and financing measures. Regular liquidity planning and a liquid investment structure ensure that Hannover Re is able to make the necessary payments at all times. Hannover Re’s cash flow is shown in the consolidated cash flow statement.
Hannover Re does not conduct any automated internal cash pooling within the Group. Liquidity surpluses are managed and created by the Group companies. Various loan relationships exist within the Hannover Re Group for the optimal structuring and flexible management of the short- or long-term allocation of liquidity and capital.
| Consolidated cash flow statement | ||
| in EUR million | 2018 | 2017 |
|---|---|---|
| Cash flow from operating activities | 2,224.6 | 1,693.9 |
| Cash flow from investing activities | (2,075.2) | (942.3) |
| Cash flow from financing activities | 149.5 | (690.0) |
| Exchange rate differences on cash | 16.9 | (74.5) |
| Change in cash and cash equivalents | 315.8 | (13.0) |
| Cash and cash equivalents at the beginning of the period | 835.7 | 848.7 |
| Change in cash and cash equivalents according to cash flow statement | 315.8 | (13.0) |
| Cash and cash equivalents at the end of the period | 1,151.5 | 835.7 |
| Thereof cash and cash equivalents from IFRS 5 | 78.6 | – |
| Thereof cash and cash equivalents at the end of the period excluding disposal group | 1,072.9 | 835.7 |
Cash flow from operating activities
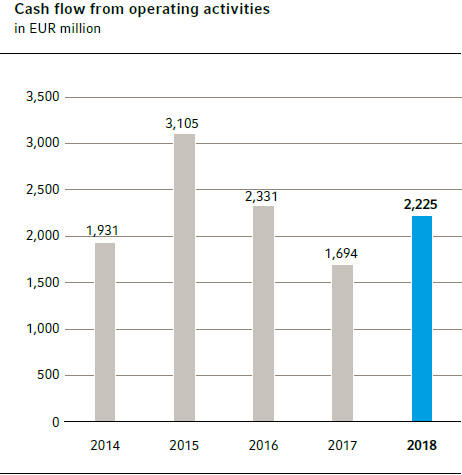
The cash flow from operating activities, which also includes inflows from interest received and dividend receipts, amounted to EUR 2,224.6 million in the year under review as opposed to EUR 1,693.9 million in the previous year. The increase of altogether EUR 530.7 million was essentially due to higher claims paid in the previous year as a consequence of the comparatively heavy burden of losses in 2017.

Cash flow from investing activities
The balance of cash inflows and outflows from operating activities and investing activities in an amount of EUR 2,075.2 million (EUR 942.3 million) was invested in accordance with the company’s investment policy, giving particular consideration to the matching of currencies and maturities on the liabilities side of the technical account. Regarding the development of the investment portfolio please see also our remarks at the beginning of this section.
Cash flow from financing activities
The cash inflow from financing activities amounted to EUR 149.5 million (cash outflow of EUR 690.0 million) in the year under review. This item includes primarily the dividends paid out by Group companies in the financial year totalling EUR 657.7 million (EUR 647.1 million) and the receipts from issuance of a senior bond in a nominal amount of EUR 750.0 million.
Overall, the cash and cash equivalents therefore increased year-on-year by EUR 315.8 million to EUR 1,151.5 million.
For further information on our liquidity management please see the risk report.